Overview
TIMED Doppler Interferometer (TIDI)
Principal Investigator:
Aaron J. Ridley
Co-Investigators:
Chen Wu
Previous Principal Investigators:
T. L. Killeen
W. R. Skinner
R. Niciejewski
Original team:
November 2023
Contents:
- Overviews
- TIDI Data Acquisition Summary
- Figure 5: TIDI Viewing Geometry
- TIDI Coverage Plots
- Introduction
- Figure 6: TIMED solar beta angle variation for the first two years after launch.
- Solar beta angle
- Day or night: which mode is TIDI running?
- Day or night: where are the four tangent points?
- Positive and negative solar beta angles: the effect of yaws
- The case at equinox
- Evolution in local time coverage
- Evolution in latitude coverage
- The case at solstice
- Figure 7: TIDI coverage at equinox, large positive beta angle
- Figure 8: TIDI coverage at equinox, large negative beta angle
- Figure 9: TIDI coverage at equinox, beta angle near 0
- Figure 10: TIDI coverage at the boreal summer solstice, large positive beta angle
- Figure 11: TIDI coverage at the boreal summer solstice, large negative beta angle
- Figure 12: TIDI coverage at the boreal summer solstice, beta angle near 0
- Introduction
- Summary: Yaw Maneuver and TIDI Coverage
- Figure 13: Warm side tangent point latitude limits
- Figure 14: Cold side tangent point latitude limits
- TIDI Science Measurement Summary
- Primary objectives: measurement priorities and accuracies (wind errors)
- Figure 15: TIDI line of sight wind accuracy requirements
- Emissions Observed
- Primary objectives: measurement priorities and accuracies (wind errors)
- Information for Proposers
- Validation Lessons from UARS/HRDI
- Special TIDI Topics
- Twilight observations
- Polar coverage and auroral contamination
- Magic latitudes
- Figure 16: TIDI warm (blue) and cold (red) side tangent locations for a representative day, shown overlaying the globe. TIMED performs at least 14 complete orbits per day.
- Clustering of instruments
Download this document as a PDF. The file is under 2 MB.
1. Overviews
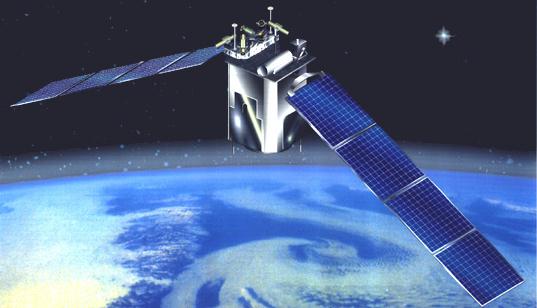
1.1 TIMED Overview
Thermosphere Ionosphere Mesosphere Energetics and Dynamics (TIMED) is the first science mission in the Solar Terrestrial Probe Program detailed in NASA’s 1994 Strategic Plan. TIMED will explore Earth’s Mesosphere and Lower Thermosphere/Ionosphere (MLTI) (60-180 km), the least explored and least understood region of our atmosphere. It is known that the global structure of this region can be perturbed during stratospheric warmings and solar-terrestrial events, but the overall structure and dynamics responses of these effects are not understood. Advances in remote sensing technology employed by TIMED instrumentation enable us to explore this region on a global basis from space. A strong collaboration with ground-based instrumentation is planned.
TIMED is part of NASA’s initiative to lower mission costs and provide more frequent access to space. The TIMED mission is scheduled for launch in May 2000. TIMED is managed for NASA by The Johns Hopkins University Applied Physics Laboratory, Laurel, Maryland.
The primary objective of the TIMED mission is to investigate and understand the energetics of the MLTI region. The MLTI is a region in which energetic solar radiation is absorbed, energy input from the aurora maximized, intense electrical currents flow, and upwardly propagating waves and tides break. Yet, this region has never been the subject of a comprehensive, long-term, global investigation. Together with simultaneous ground-based observations, TIMED will provide for the first time a core subset of measurements defining the basic states of the MLTI region and its thermal balance.
The specific TIMED Mission Goals are:
- To determine the pressure, temperature, density, and wind structure in the MLTI region, including seasonal and latitudinal variations.
- To determine the relative importance of various radiative, chemical, electrodynamical, and dynamical sources and sinks of energy for the thermal structure of the MLTI.
TIMED measurements will be important for understanding the basic processes involved in the energy distribution of this region and the impact of natural and anthropogenic variations. In a society increasingly dependent upon satellite technology and communications, it is vital to understand atmospheric variability so its effects on satellite tracking, spacecraft lifetimes, degradation of materials, and re-entry of piloted vehicles can be predicted. The mesosphere may also show evidence of anthropogenic effects that could herald global-scale environmental changes. TIMED will characterize this region to establish a baseline for future investigations of global change.
1.2 TIDI Overview
The TIMED Doppler Interferometer (TIDI) will investigate the dynamics and energetics of Earth’s mesosphere and lower-thermosphere-ionosphere (MLTI) from an altitude of 60-300 km. TIDI measurements will allow us to obtain a global description of the vector wind and temperature fields, as well as important information on gravity waves, species densities, airglow and auroral emission rates, noctilucent clouds, and ion drifts. TIDI will provide basic information about global winds and temperatures. TIDI will also contribute to the study of MLTI energetics.
The TIDI interferometer (or Profiler) primarily measures horizontal vector winds and neutral temperatures from 60 to 300 km, with a vertical resolution of ~2 km at the lower altitudes and with accuracies that approach ~3 m/sec and ~2 K, respectively, under optimum viewing conditions. The TIDI design allows for 100% duty cycle instrument operation during daytime, nighttime, and in auroral conditions. TIDI views emissions from OI 557.7 nm, OI 630.0 nm, OII 732.0 nm, O2 At (0-0), O2 At (0-1), Na D, OI 844.6 nm, and OH Meinel (9-4) and (7-3) to determine Doppler wind and temperature throughout the TIMED altitude range. TIDI also makes spectral ratio observations to determine O2 densities and rotational temperatures.
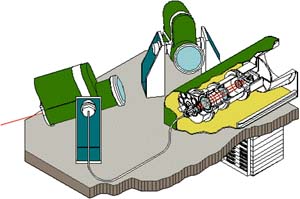
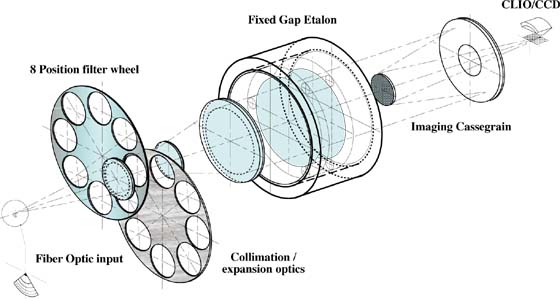
Instrument Description
TIDI comprises three major subsystems: four identical telescopes, a Fabry-Perot interferometer with a CCD detector, and an electronics box. Light from the selected regions of the atmosphere is collected by the telescopes and fiber-optically coupled to the detection optics. The four fields of view are scrambled along with a calibration input and converted to an array of five concentric circular wedges. This input then passes through a selected filter, then through a Fabry-Perot etalon, and is finally imaged onto a CCD via a circle-to-line imaging optic (CLIO) device.
TIDI System
| Mass: | 41.8 kg |
| Electrical Power: | 19.32 watts (orbit ave.) |
| Heater Power: | 11.0 watts |
| Data Rate: | 2494 bits/sec |
| Observations: | winds, temperatures, and density |
| Wind Accuracy: | 3 m/s (line of sight) |
| Altitude Resolution: | 2 km |
| Spectral Range: | 550-900 nm |
| Lifetime: | >2 years |
© Copyright SPRL Engineering
Figure 1. TIDI layout
(showing two of four telescopes).
Electronics System
Hybrid Power supply
80C51 (UTMC) Flight computer
Data acquisition
CCD controller
Filter wheel/ shutters/ PWM heaters
Telescope servo amp
Calibration lamp power supply
© Copyright SPRL Engineering
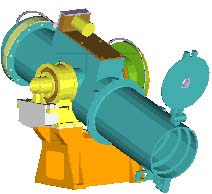
Figure 2. TIDI Telescope
Telescope Specifications
Off-axis Gregorian
Low scatter optics and baffles
Zenith gimbal
Clear Aperture 7.5 cm
Area 44.2 cm2
Angular FOV 2.5° horizontal x 0.05° vertical
F/number 2.2
© Copyright SPRL Engineering
Figure 3. Interferometer Optics
| Profiler Specifications Fixed gap single etalon Fabry-Perot interferometer 2 x 8 position filter wheel Circle-to-line image converter (CLIO) Passively Cooled CCD detector 5 x 32 Channels Clear Aperture 7.5 cm Plate Diameter 10.5 cm Gap 2.2 cm Finesse 8.1-8.9 |
© Copyright SPRL Engineering
Figure 4. CCD Detail
2. TIDI Acquisition Summary
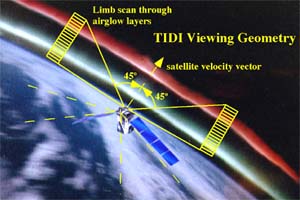
The TIDI telescopes perform limb scans through the terrestrial airglow layers throughout the satellite orbit. TIDI obtains these scans simultaneously in four orthogonal directions: two at 45° forward but on either side of the satellite’s velocity vector and two at 45° rearward of the satellite. These four views provide the measurements necessary to construct the horizontally resolved vector winds as a function of altitude within the MLTI region along two parallel tracks, one on either side of the spacecraft. Each vertical scan consists of individual views 2.5° (horizontal, along the limb) by 0.05° (vertical, normal to the limb) in angular size. The vertical altitude resolution of the instrument is 2.5 km, but the altitude spacing between views will be adjusted to yield a measurement vertical resolution of half a scale height throughout the limb scan. The altitude step size will range from 2.5 km in the MLTI region to 25 km in the thermosphere. Each up/down acquisition cycle will take 100-200 seconds to complete, resulting in a nominal horizontal spacing between profiles of approximately 750 km along the orbit track. The exact time per vertical scan will depend on the mode being run and the integration or dwell time needed at each altitude step. Each up/down scan cycles through a sequence of filter tunings, selecting the optimal emissions to be viewed within each altitude range to allow rotational and/or Doppler temperatures as well as neutral winds to be retrieved. More information about the dayside and nightside science modes being planned and their estimated accuracy (wind errors) as a function of altitude is given below in the TIDI Science Measurement Summary.
3. TIDI Coverage Plots
3.1 Introduction
The precession rate of TIMED is such that it will take 60 days to precess 12 hours in local time (3° per day). On any given day there is little change in local solar time coverage at low and mid-latitudes. The most useful parameter for describing the TIDI local time coverage and viewing geometry is the solar beta angle, the complement of the angle between the normal to TIMED’s orbital plane and the earth-sun line. If the solar beta angle is 90°, then the normal to the orbital plane is parallel to the earth-sun line. If the solar beta angle is 0°, then the normal to the orbital plane is perpendicular to the earth-sun line. The variation in solar beta angle through the first two years of the TIMED mission is shown in Figure 6.

The transition between TIDI dayside and nightside modes of observation is made when the solar zenith angle (SZA) at the spacecraft reaches 90°. The solar scattering angle, the angle between the line of sight to the tangent position and the sun, creates a secondary but crucial consideration in the instrument operation. A TIDI telescope will not perform observations if the solar scattering angle is less than 15°, that is if the direction to the sun is within 15° to the direction of the tangent position. This sun-avoidance criterion prevents TIDI from directly viewing the sun. As long as the solar scattering angle is acceptable (>15°), TIDI will seamlessly continue data acquisition during the transition between day and night, as the spacecraft passes through 90° in solar zenith angle. It is possible for any number of the four tangent points (from none to all four) to be in twilight at a given moment. The TIDI data inversion technique becomes less successful when the tangent point viewed by a TIDI telescope is in twilight. For twilight views, only line-of-sight data products (Level 1 data) will be available; inversion products (Level 2 data, such as altitude profiles of the neutral horizontal winds) will not be produced.
Consequently, optimum TIDI daytime observations are performed when:
- the solar zenith angle at the tangent point is less than 80°
- the solar zenith angle at the spacecraft is less than 90°
- the solar scattering angle is greater than 15°
and nighttime observations are performed when:
- the solar zenith angle at the tangent point is greater than 100°
- the solar zenith angle at the spacecraft is greater than 90°
- the solar scattering angle is greater than 15°
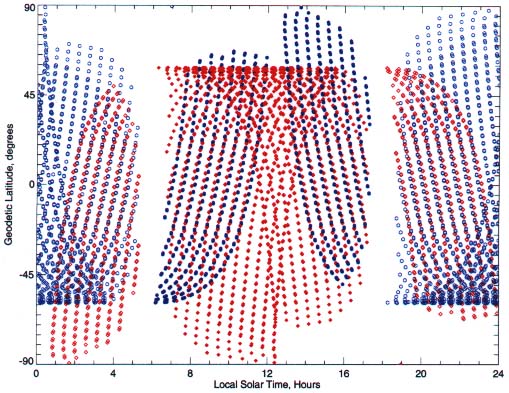
The following figures describe the relationship between the solar beta angle, the solar scattering angle, daytime/nighttime observations and TIDI coverage for representative orbits. In each of the plots:
- symbols represent the local solar time/latitude of the tangent point at 100 km altitude
- the hatched area corresponds to night; clear to day
- the dashed lines indicate the boundaries of twilight (defined by the tangent point solar zenith angle being SZA = 90° ± 10°)
- daytime observations are represented by solid symbols; nighttime by open symbols
- red diamonds represent tangent points on the sun side (warm side); blue hexagons are the anti-sun-side (cold side) of the spacecraft
3.2 Solar beta angle
The variation in the TIMED solar beta angle is illustrated in Figure 6 for the first two years after launch. This angle describes the relative orientation of the TIMED orbital plane to the earth-sun line. The solar beta angle is therefore a function of season and of the phase of the orbit in its precession. The beta angle evolves in time as the TIMED orbit precesses, reaching a local extremum once every 60 days. For a given time of year (specified orientation of the earth-sun line to the Earth’s equatorial plane), the range of possible solar beta angles is determined by the range of possible phases, or orientations, of the TIMED orbit about its axis of precession. The upper and lower bounds in solar beta angle are therefore functions of the season only. The actual beta angle at any time of year always falls within these time-dependent bounds but is determined by the initial phase of the TIMED orbit at launch.
At the equinox, the solar beta angle must fall within the range of -74° to +74°. Because the earth-sun line lies in the Earth’s equatorial plane at equinox, the beta angle range is symmetric about 0° and the absolute value of the upper and lower bounds equals the 74° orbital inclination of TIMED. The range of possible solar beta angles is not symmetric about 0° at any other time of year, because the earth-sun line is then at an angle to the equatorial plane. During the solstice, the solar beta angle extrema become TIMED’s orbital inclination angle plus/minus the Earth’s orbital inclination angle of 23°; that is, the absolute value of the solar beta angle limits are 51° and 83° (the supplement of 74° + 23° = 97°). The range of possible beta angles at the boreal summer solstice (June) extends from -51° to +83°; during the austral summer solstice (December), the range shifts to -83° to +51°. Only at the times of the year when the earth-sun line is 16° off the equatorial plane can the beta angle reach the largest possible absolute value of 90°; under this seasonal condition, the range of possible beta angles extends either from -58° to +90°, or from -90° to +58° (the absolute value of these extrema being 74° 16°).
Figures 7-9 illustrate the data coverage patterns for three cases spanning the range of solar beta angles which are possible at equinox, and figures 10-12 depict the sampling patterns for the comparable examples from the range of possible beta angles at solstice. [Please note that the twilight demarcations (dashed lines) are incorrectly drawn in the equinox cases, figures 7-9. The edges of twilight should form closed contours on the day and night sides of the terminator. The figures should show two vertical dashed lines extending from -80° to +80° latitude, at 40 minutes on either side of dawn (6 hr) and dusk (18 hr), then extending at constant latitudes of 80° through the remaining day and night hours to form closed contours on the day and night sides, respectively. These figures will be corrected shortly. ]
3.3 Day or night: which mode is TIDI running?
As the spacecraft crosses the day/night terminator (spacecraft SZA = 90°), TIDI switches operations between day and night modes. Because TIDI is operated in day and night modes during equal portions of each orbit, the measurements for both the warm side (sun-side) and cold side (anti-sun-side) telescopes are divided in an approximate 50/50 ratio into distinct zones of day and night observations (solid versus open symbols). The switch between day and night modes creates some spatial overlap in the day and night observations in the vicinity of twilight, because the two views of the same region, rendered along the same track by the forward and rearward-looking telescopes, are separated by about 7 minutes, and in the intervening time the spacecraft crosses the day/night boundary and the instrument switches modes.
3.4 Day or night: where are the four tangent points?
It is very important to understand the distinction between the local time at the measurement location (whether the tangent point for a given telescope view lies on the day or night side of the terminator) and the mode of TIDI instrument operation (day or night, indicated by the solid versus open symbol) at the time that measurement is made. Near twilight, the four telescope views straddle the day/night terminator, while the instrument is run in either day or night mode (as determined by the spacecraft’s solar zenith angle). For some views, there will be a mismatch between the local time of the view (day/night) and the mode being run (night/day). In those cases where the tangent point location is on the “wrong” side of the day/night terminator to match the instrument mode being run, the altitude scan for that tangent point location will be of limited use, at best. Most of these mismatched measurements will fall within the defined bounds of twilight but a few will occur outside the twilight bounds. In figures 7-12, only solid symbols on the day side and open symbols on the night side should be deemed to represent good or useful measurements, and then only if they fall outside the twilight region (outside the dashed lines on either side of the terminator).
3.5 Positive and negative solar beta angles: the effect of yaws
The TIMED satellite will perform yaw maneuvers (spacecraft rotations from forward flight to backward flight) once every 60 days when the solar beta angle approaches 0. The spacecraft is yawed forward as long as the solar beta angle is positive and rotates to backward flight when the beta angle becomes negative. These yaw maneuvers prevent the “cold” side of the spacecraft from ever facing the sun.
What effect do these yaw maneuvers have on the TIDI observations? Considering the pairs of TIDI telescopes on the warm and cold sides of the spacecraft, respectively, the simple answer is that the yaw maneuver reverses which pair looks to the north side and which to the south side of the satellite orbit track, each time the spacecraft turns around. In forward flight, the track of warm side observations lies northward of the orbit track, whereas the cold side track lies southward of the orbit track. As the positive beta angle cases in Figures 7, 10, and 12 illustrate, in forward flight, the northern polar region can be viewed only by the warm side telescopes, and the southern polar region is viewed only by the cold side. For negative beta angles (backward flight examples shown in figures 8, 9, 11), the northern pole is observed by the cold side, and the southern pole by the warm side. Comparing these two sets of figures, one sees that the distinctive oval patterns of warm and cold side measurements are inverted about the equator for positive versus negative beta angle. Note that the view which extends to the pole in one hemisphere reaches a “turnaround” latitude of about 58° in the opposite hemisphere.
3.6 The case at equinox
At the equinox, if the solar beta angle approaches its greatest absolute value, as shown in Figure 7 ( beta = +74°) and Figure 8 ( beta = -74°), then the orbital path skirts the twilight meridian. The tangent point locations for the two telescopes on the warm side (shown in red) nearly always fall on the daytime side. Correspondingly, the observations for the other two telescopes, on the cold side (shown in blue) are located on the nighttime side. As Figure 9 illustrates, when the solar beta angle achieves values closer to zero, the warm side telescopes spend more time viewing night and the cold side viewing day.
3.7 Evolution in Local Time Coverage
Figures 8 and 9 both depict cases of negative beta angle, for which the spacecraft is yawed backwards, under equinox conditions. The beta angle is far from zero in one case (figure 8) and very near zero in the other (figure 9). The major difference between these cases is simply that the distinctive oval sampling patterns are shifted by six hours in local solar time. This same local time shift by six hours is illustrated in Figures 10 and 12 for the respective cases of positive beta angle changing from the solstitial maximum (figure 10) to near zero (figure 12). Within the interval between yaws, the beta angle starts at zero, grows to the extremum value, and returns to zero. Correspondingly, the oval patterns of warm and cold side measurements each shift through 12 hours in local time. Between the day and night coverage on both the warm and cold sides, observations at a given latitude span all 24 hours in local time within the 60-day interval between yaws.
3.8 Evolution in latitude coverage
Another way to look at this shift in the local time sampling at a given latitude over a yaw cycle is to consider the effect on the daily latitudinal coverage. As the solar beta angle grows and diminishes, the latitude coverage of the day and night measurements for the warm and cold sides evolves. As can be seen in Figure 9, near equinox, for negative beta angles near zero the useful warm side daytime measurements (solid red symbols on the day side) extend from the high southern latitudes all the way to the turnaround latitude of +58° in the northern hemisphere. Because the day/night coverage is symmetric about the equator at the equinox, the cold side daytime observations similarly extend from -58° to the northern pole. Adding together the warm and cold views, the daytime coverage extends pole to pole, as does the nighttime coverage (barring twilight conditions at the pole).
By contrast, figure 8 shows that (still considering the equinox) when the beta angle is large and negative, usable daytime observations on the warm side are limited to the northern hemisphere, from the equator to +58°. The cold side does not contribute any usable daytime measurements because when the dayside mode is operating, all the cold side points (blue solid symbols) fall at night or twilight. Similarly, when the beta angle is large and positive at the equinox (figure 7) the only usable daytime observations again come from the warm side, this time spanning the southern hemisphere from the equator to -58°. Of course, as the beta angle evolves over a yaw period, the terminator pattern would not stay fixed at perennial equinox conditions but rather would evolve seasonally, adding complexity to the temporal variations in latitude coverage.
3.9 The case at solstice
Solstice conditions are illustrated in figures 10-12 for the range of possible solar beta angles (-51° to +83°) at the boreal summer solstice. In the case of beta near the maximum of 83°, as shown in Figure 10, the warm side telescopes will spend the entire orbit viewing daylight, and the cold side viewing night. Figure 11 shows the opposite case of large negative beta angles, approaching the extremum of -51°. In this case, the two sampling ovals cut through both day and night and the warm and cold side views are each a mixture of day and night observations. At the equinox, the symmetry in the terminator about the equator meant that the separation of warm and cold sides into day and night observations was maintained for both extremes in beta angle (contrast figures 7-8 with figures 10-11). At the solstice, the terminator asymmetry between hemispheres means this day/night division between warm and cold views is only realized in one of the two extremes in the beta angle. For boreal summer solstice, the spacecraft skirts the terminator when the beta angle approaches +83°; at austral summer solstice, this condition is realized when the beta angle is close to -83°. At smaller absolute values of the solar beta angle, the tangent point locations for each side of the spacecraft are mixed between daylight and night. Comparing figures 10 and 12 for large versus small values of the beta angle (positive in both cases) again shows the local time shift in the warm and cold side sampling patterns and the corresponding changes in latitude coverage of the day and night measurements.
4. Summary: Yaw Maneuver and TIDI Coverage
At all times of year, the oval sampling patterns of the warm and cold side tracks have the same morphology. Within a yaw cycle, the placement of this pattern in local time depends solely on the value of the solar beta angle. The whole pattern is inverted about the equator with every yaw. When the spacecraft is yawed forward, the northern pole is viewed by the warm side, and the southern pole by the cold side. When the spacecraft is yawed backward, the warm and cold side views are reversed about the equator. The effects of these inversions in the warm and cold side patterns have been discussed at length in the preceding section, and the latitude/local time coverage under the possible extremes of beta angle and seasonal conditions have been illustrated in Figures 7-12.
The shape of the day/night terminator changes throughout the year, and the evolving pattern of day and night interacts with the local time/beta angle placement of the sampling pattern to produce a rather complex evolution in the latitude coverage of the day and night measurements. The latitude coverage is affected primarily by two factors. First, the local time and latitude of the terminator crossings define when the TIDI instrument changes between day and night modes. Second, the shape of the terminator and its relative orientation to the pattern of warm and cold side TIDI measurements determines what range of measurements falls in twilight conditions.
Here we illustrate the interplay of the actual solar beta angle evolution as the orbit precesses with the seasonal evolution in the day/night terminator. A realistic prediction of the latitude coverage is made by factoring in the tangent point solar zenith angle mask for twilight and the solar scattering angle sun avoidance criterion. Results from an orbital propagation run, daytime mode only, for a two-year lifetime are displayed in figures 13 and 14, showing the latitudinal extent of the daytime mode data on the warm and cold sides, respectively.
The most distinctive behavior is a “ledge” at 58° latitude in the maximum poleward view on the warm side that occurs when the warm side telescopes point equatorward (note that the cold side telescopes will then point to the pole).
Depending on the season and the solar beta angle, the cold side telescopes may not be able to perform any daytime mode measurements due to solar zenith angle considerations (the warm side will continue to perform, however). This condition is reached at a large enough beta angle (positive or negative) when the spacecraft skirts the terminator, in which case the cold side always views either night or twilight.
Depending on the season, there are distinct latitude limits that restrict the dayside terrestrial coverage of TIDI. Considering the warm side and cold side coverage together, in the worst cases, only one dayside (either the northern or the southern) hemisphere can be sampled per orbit.
A similar set of criteria holds for the nighttime measurements on the warm and cold sides (night mode latitudinal coverage plots not shown).
Collecting tangent samples over an entire yaw period allows a nearly complete local solar time/latitude map to be constructed. The interplay of the yaw phase (forward or backward) with the seasonal cycle determines how complete the local time coverage will be in the polar regions. The solar zenith angle effect always removes the twilight measurements, however, creating some gaps in the local time coverage at all latitudes, though the severity of these gaps varies with latitude and season.
Each individual TIDI measurement provides the line-of-sight wind by extracting the Doppler shift of the observed airglow emission feature. Two measurements at each altitude are required to construct a horizontal velocity vector for each altitude. An inversion of the line-of-sight winds provides a final product from TIDI: an altitudinal profile of the MLTI horizontal winds.
5. TIDI Science Measurement Summary
5.1 Primary objectives: measurement priorities and accuracies (wind errors)
The priority for TIDI is to measure the horizontal neutral winds in the MLTI region, and the dayside and nightside scanning modes will be optimized to deliver high-quality wind data. TIDI will also obtain altitude profiles of rotational and Doppler temperatures, volume emission rates, and minor species concentrations, but these measurements are considered secondary in importance to the wind measurements.
The required accuracy as a function of altitude for TIDI dayside line-of-sight wind measurements is shown in Figure 15. This is the minimum accuracy needed to meet the TIMED mission science objectives. Note that the required accuracy varies significantly with altitude: wind errors of 15 m/s are tolerable in the thermosphere, but in the MLTI region the wind errors cannot exceed 3 m/s. The TIDI science team has made obtaining measurements that meet or exceed these accuracies a primary requirement for designing the dayside scanning modes. At altitudes where nightside data are available, comparable accuracies will be achieved for the nightside observations. We will adjust the integration time (dwell time) at each altitude in the up/down scan data acquisition sequence to achieve these required wind accuracies. An integration time of approximately 8 seconds is needed to reduce the wind error to 15 m/s at 200 km, whereas an integration time as short as 1 second can deliver a wind error of 3 m/s near 90 km. Other factors that can be adjusted to decrease the wind errors are the size of steps taken in altitude (affects the vertical resolution) and the range of altitudes scanned for each profile. The altitude step size will start at 2.5 km in the lower MLTI region, and increase to around 25 km in the thermosphere. Any adjustment that lengthens the total time of each up/down scan sequence adversely affects the horizontal measurement resolution because the profiles will be spaced farther apart along the orbit track.
The other objective regarded as a primary requirement is that the dayside altitude scan must obtain winds at a vertical resolution of half a scale height throughout the altitude range of 60-180 km. This is the altitude range of principal importance for the TIMED mission. If possible, the TIDI measurements will be extended higher in the thermosphere, but only if acceptable wind errors and vertical and horizontal resolution can still be achieved for the measurements within this primary range. In short, there is a trade-off to be made between the wind accuracy, altitudinal coverage, and vertical and horizontal resolution achieved. The TIDI science modes will be optimized to give the best accuracy, resolution, and data coverage possible.
Figure 15. TIDI line of sight wind accuracy requirements for optimal daytime measurements.
Emissions observed
The filter wheels for TIDI contain a complement of fourteen interference filters carefully chosen to allow full daytime altitudinal coverage of neutral wind and temperature measurements throughout the MLTI. The measurement is optimized by setting the filter wheels to view the most appropriate emission within each altitude range. Altitudinal coverage during nocturnal periods is reduced since the terrestrial airglow exhibits a discrete layer behavior when the sun is not present. Tables 1 and 2 summarize the TIDI measurements for dayside and nightside modes, respectively, by listing the altitude range over which it is possible to obtain useful measurements from each emission. In cases of overlap, it has yet to be determined which emission will be viewed at a given altitude.
Table 1. Dayside Measurements
| Measurement | Feature | Altitude Range |
| Vector Wind | O2 Atmosphere (0-1) P11 | 60 – 85 km |
| O2 Atmosphere (0-0) P9 | 85 – 120 km | |
| OI (557.7 nm) | 90 – 250 km | |
| OI (630.0 nm) | 200 – 300 km | |
| OII (732.0 nm) | 170 – 300 km | |
| Neutral Temperature | O2 Atmosphere (0-1) P11 and O2 Atmosphere (0-1) P7 | 60 – 85 km |
| O2 Atmosphere (0-0) P9 and O2 Atmosphere (0-0) P15 | 85 – 120 km | |
| OI (557.7 nm) | 100 – 150 km | |
| OI (630.0 nm) | 200 – 300 km | |
| O2 Density | O2 Atmosphere (0-0) Volume Emission Rate | ~100 km |
| O2 Atmosphere (0-1) and O2 Atmosphere (0-0) | 60 – 90 km | |
| O Density | OII (732.0 nm) and OI (844.6 nm) | 150 – 300 km |
| O3 and O(1D) density | O2 Atmosphere Volume Emission Rate | 70 – 95 km |
Table 2. Nightside Measurements
| Measurement | Feature | Altitude Range |
| Vector Wind | OH Meinel (7-3) | 80 – 90 km |
| Na D | 85 – 95 km | |
| O2 Atmosphere (0-0) P9 | 85 – 105 km | |
| OI (557.7 nm) | 95 – 105 km | |
| OI (630.0 nm) | 200 – 300 km | |
| Neutral Temperature | OH Meinel (7-3) | 80 – 90 km |
| Na D | 85 – 95 km | |
| O2 Atmosphere (0-0) P9 and O2 Atmosphere (0-0) P15 | 85 – 105 km | |
| OI (557.7 nm) | 95 – 105 km | |
| OI (630.0 nm) | 200 – 300 km | |
| O Density | OH Meinel | 80 – 95 km |
| O2 Atmosphere | 85 – 100 km | |
| OI (557.7 nm) | 90 – 105 km |
6. Information for Proposers
One of the most important needs for TIDI from the aeronomical community is a strong collaboration with ground-based instrumentation groups. As in previous (and current) space missions that utilize minute Doppler frequency shifts of terrestrial emissions for determining horizontal wind profiles, data validation is an important process that must be ongoing throughout the mission. The following are lessons that were learned from the UARS/HRDI validation program.
6.1 Validation lessons from UARS/HRDI
the requirements for a validation program are not the same as for a correlative science program
- for validation, the HRDI science team required measurements of the same quantity at nearly the same time and location
- for correlative science, the HRDI science team took advantage of the unique capabilities of both observational programs: 1) ground stations provide extensive local time coverage each day but limited spatial coverage; 2) satellites provide extensive spatial coverage each day but limited temporal coverage
validation is a data-hungry process
- different observing conditions between satellite-based and ground-based observatories imply that statistical measurements are the most useful validation parameter
- small data sets are of limited value
- validation data are required for the life of the mission
transit predictions must be supplied to ground-based observers on a regular and timely basis
- HRDI provided these predictions with an 8-week advance notification
- the procedure was automated
- the transit history is an important tool
UARS had ‘official’ and ‘unofficial’ ground-based observer support
- ‘official’ support implied that observers received funding support to supply data to the UARS database
- ‘unofficial’ indicated informal liaisons initiated by instrument teams or ground-based groups for mutual scientific benefit
a simple and common data format saves time
- UARS employed official validation data in Ames format, stored on the Central Data Handling Facility (CDHF)
- official investigators provided data to UARS instrument teams, who then converted the data streams and forwarded them to CDHF: 1) the Ames format was difficult to implement; 2) the process was very slow
- commercial formats or ASCII format is preferable
it is essential to understand the limitations of each measuring system in terms of
- spatial coverage
- spatial resolution
- temporal coverage
- temporal resolution
it is essential to appreciate when data may be suspect
- data error bars usually imply statistical error, but not biases in the data
geophysical effects limit the amount of useful validation data
- tidal effects are sufficiently large which requires that validation data be matched in local time to a few hours
- interannual climatological effects are sufficiently large implying that data comparisons from different periods are inadequate
- small scale features, such as gravity waves, have specific and unique effects on different experimental methods
MF radars were used extensively by UARS/HRDI
- MF radars run continuously and provide large databases
- MF radars were not as accurate as initially advertised
optical ground-based measurements were not very useful for UARS/HRDI validation efforts
- HRDI measurements were concentrated over the range 65 – 105 km altitude during the day and only ~94 km at night
- very few ground-based optical observers acquired daytime data in the HRDI altitude range
- no ground-based optical observers supplied geophysical data extracted from molecular oxygen emissions
rocket falling spheres were used extensively by UARS/HRDI
- spheres provided good accuracy for wind and temperature validation
- the limited number of sounding rocket launches implied a small database
- the altitude range was limited to the mesopause and below
- validation efforts required very careful coordination to avoid lost opportunities
6.2 Special TIDI Topics
Proposers should be aware of the following four special TIDI operational interests. The discussions of twilight conditions and auroral contamination in the polar regions alert data users to limitations characteristic of the data obtained under these conditions. Special opportunities for researchers are suggested in the discussions of the magic latitudes and polar coverage. In these regions, TIDI achieves especially desirable sampling patterns or data coverage. These data quality and coverage issues also have a significant bearing on a very important concern of the TIDI science team: our need for correlative data for validation of the TIDI measurements. The final topic makes some additional recommendations for the optimal ground-based sampling to support validation, in particular the utility of clustering ground-based instruments together at one site.
Twilight observations
Unless limited by the solar scattering angle, TIDI data are acquired continuously throughout each TIMED orbit. The TIDI inversion algorithm will ignore any data point obtained when the tangent location for that point is in twilight. The line of sight for any telescope which is directed at a tangent point in twilight will also include a contribution from dayglow from volume elements located somewhere in the telescope’s field of view. It is difficult to model the location of the volume elements that provide the greatest contribution to the integrated emission rate viewed from space when the tangent altitude is experiencing twilight. As a result, only line-of-sight data products will be available for twilight views (such as integrated emission rate), not inversion products (such as altitude profiles of the neutral horizontal wind).
Polar coverage and auroral contamination
Seasonal variations in polar coverage
The TIMED orbit will permit TIDI to acquire data from high latitudes. The lack of solar illumination during a hemisphere’s winter solstice season restricts the altitude resolution of TIDI to those altitudes that originate from thin nocturnal airglow layers. The evolution of the solar beta angle will also restrict the highest latitudes that TIDI can view during solstice in either day or night. Consequently, the TIDI data coverage at the highest latitudes will not be complete. The effects of these two limitations to the high latitude coverage are illustrated in figures 13-14 for the dayside measurements.
Auroral contamination
There are two additional mechanisms that will affect TIDI data acquisition at auroral latitudes. 1) The TIDI instrument is shielded as much as possible from the influence of high-energy (keV) particles in the auroral regions, but the final determination of the shielding effectiveness will be performed after launch. 2) Contributions from auroral illumination along the line of sight of a TIDI telescope will weigh the integrated emission rate measurement in an unpredictable fashion. High latitude observations will be performed with a narrowband sodium filter designed to exclude auroral contributions from nearby spectral emissions, but the altitude resolution will be restricted. The final determination of the effectiveness of measurements impacted by auroral light will be made after launch.
Magic latitudes
As shown in Figure 16, the TIMED orbit (inclination 74°) combined with the four set azimuth angles of the limb-directed TIDI telescopes implies that there are two ‘turnaround’ latitude circles where the density of data acquisition reaches a maximum value, otherwise termed magic latitudes. For an altitude of 80 km, the magic latitudes are roughly 58° and 90° implying that either correlative or validation studies at these latitudes would enjoy the greatest probability of collocated measurements with TIDI.
Figure 16. TIDI warm (blue) and cold (red) side tangent locations for a representative day, shown overlaying the globe. TIMED performs at least 14 complete orbits per day.
Figures 17 and 18 display the sampling density in terms of the average number of profiles per day as a function of latitude for the southern hemisphere. This sampling pattern is symmetric about the equator. The average number of profiles illustrates the data coverage achieved statistically throughout the year; it does not represent the exact conditions achieved on any given day, and all profiles are counted in the average, regardless of data quality. Profiles obtained under adverse conditions such as twilight and in the auroral regions are included, and dayside and nightside profiles are counted together in these annual average distributions. Figures 13 and 14 reveal the temporal distribution throughout the year of the dayside sampling at each latitude.
Figure 17 shows the density of profiles obtained around a latitude circle. In the equatorial regions and low latitude, there are four crossings of a given latitude per orbit (measurements taken along two viewing tracks, dayside and nightside) so that on any given day and latitude, profiles are therefore obtained at four distinct local times per day (see figures 7-12). Two profiles (one per telescope) are obtained along each track, resulting in a total of 8 profiles per orbit at a given latitude. The 3° bin size in latitude corresponds approximately to the horizontal spacing of profiles along the orbit track, so in the low latitudes, the number of profiles per latitude bin is approximately 112 (14 orbits x 8 profiles/orbit at that latitude). This set of profiles is divided evenly into four distinct local times.
Figure 17. Latitude distribution of average profile density.
Near the turnaround latitude, the number of samples increases dramatically, and profiles are obtained over a broad range of local times, not simply at four distinct local times per day (see Figures 7-12). At 58°, there are about twice as many profiles within a 3° latitude band as are obtained near the equator. Because the latitudes poleward of this turnaround latitude are viewed by the telescopes on only one side of the spacecraft, the number of latitude crossings in the polar region is reduced from four to two (one day, one night) per orbit. The average number of profiles in the polar regions is only half that in the equatorial and low latitudes, roughly 56 per 3° latitude band. Correspondingly, only two local times per day are sampled poleward of 58°, as opposed to four as in the low latitudes.
Approaching the poles, the measurements from all 14 orbits per day converge spatially. Figure 18 shows the density of profiles normalized per unit area in the horizontal dimensions, using 100 km x 100 km as the measure of area. Viewing the sampling density this way, the spatial density of profiles is lowest overall at the equator and just poleward of the turnaround latitude. The area-normalized density at the turnaround latitude of 58° is not as great as at the poles. At the poles, the views from all orbits are all obtained at the same geographic location, yielding the best coverage in universal time.
Figure 18. Latitude distribution of profile density, normalized per unit area.
Clustering of instruments
The TIDI science team will benefit from correlative ground-based measurements from sites with a clustering of instruments. Clustered instrumentation can provide a more complete set of simultaneous wind, temperature, and emission data to support TIDI validation efforts.
Long-term, near-continuous operations are best
Data from ground-based experiments that operate on a near-continuous basis are more useful than measurements obtained from a limited campaign. For validation purposes, the most useful correlative measurements will be those from instruments operating on a nearly continuous basis from a fixed location throughout the duration of the TIMED mission. A campaign-mode data set of limited duration or data from an instrument that is periodically relocated will also be useful but will be secondary to a long-term data set obtained at a permanent location.